|
|
|
|
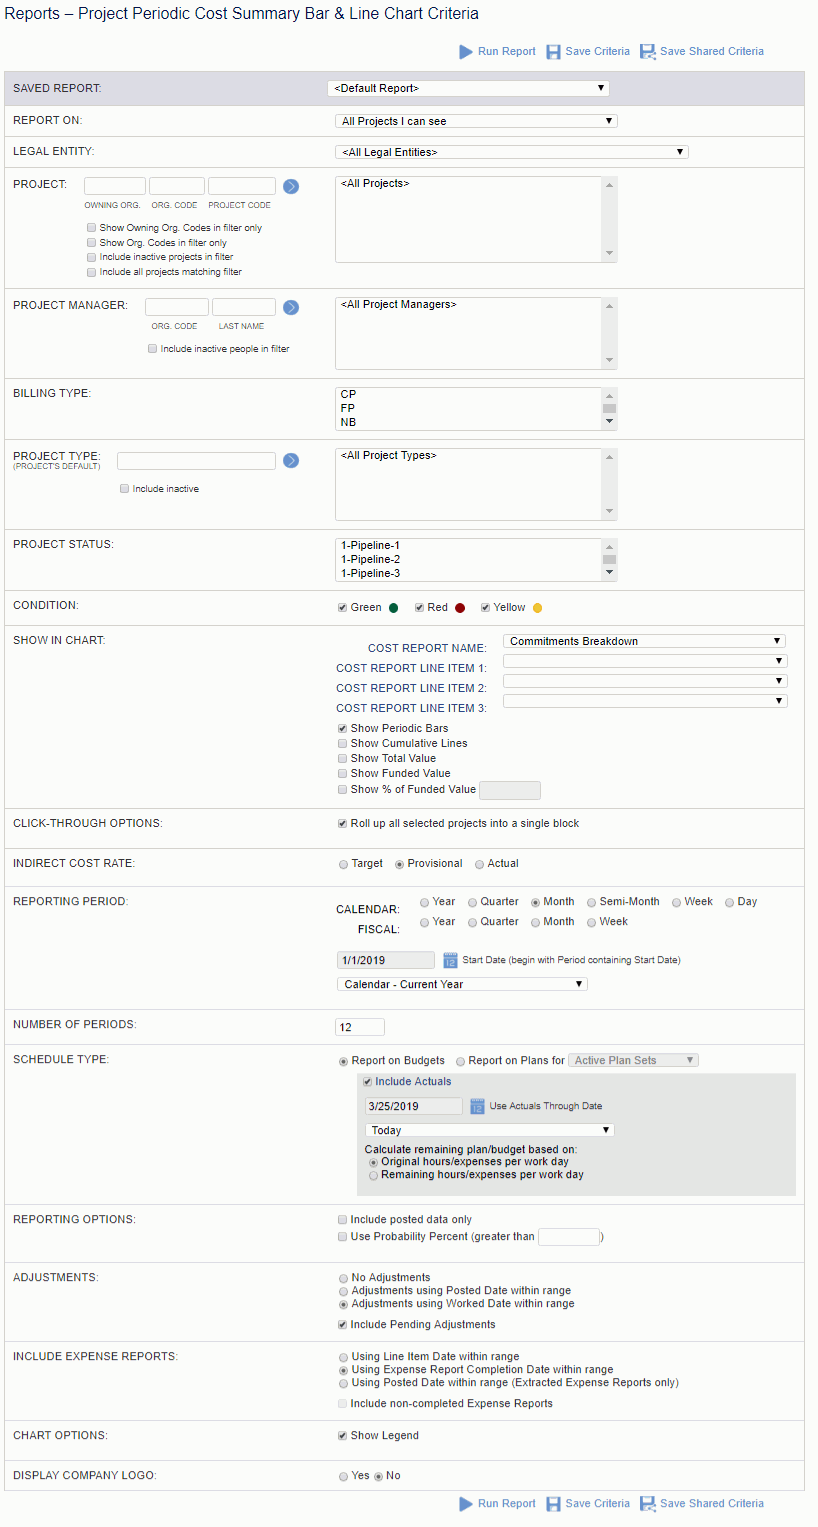
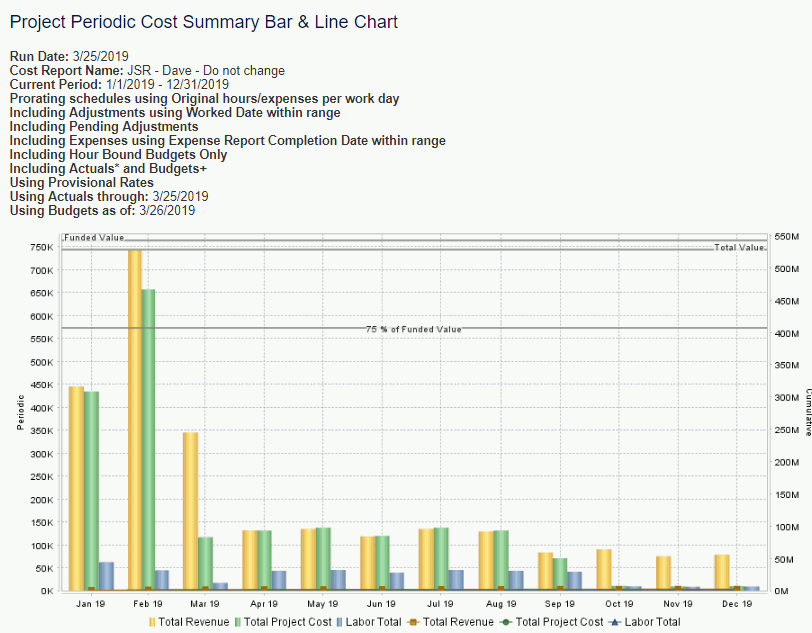
This chart can be run to provide a periodic view of time planned or charged to a project by Cost Report Line Item in a Daily, Weekly, Monthly or Quarterly bar and line chart format. At least one Cost Report line item must be specified in order for the chart to generate and you may include up to three. You can optionally show bars representing periodic amounts per cost report line item and/or a cumulative line for that cost report line item.
Click Through for Details
The resulting reports will contain a full report for all available Cost Report Line Items (not just those included in this chart) nor relative to the bar or cumulative data point clicked..
-- Only those project's having a Cost Structure defined will be included in the Project Costing reports.
-- This report includes actuals from timesheets and expense reports in any status, and from financial document labor, expense, and item detail lines.
-- This report will not run unless the Administrator has created at least one Report Definition.
This report is available to users having any of the following roles: Administrator and P&R Administrator.
Certain Project Administrator roles can have access to this report under the following conditions:
| User has Bill Rate Manager Role | User has Cost Rate Manager role | Allow Project Cost Reporting for Non-Cost Rate Managers (unanet.non_cost_mgr.allow_project_cost_reporting) property enabled | Report Access |
| Yes | No | Yes | Can see and run report |
| Yes | Yes | Yes or No | Can see and run report |
| No | No | Yes | Can see report but cannot run it |
| No | Yes | Yes or No | Can see and run report |
Note: The Project Administrator roles or "project oriented" roles referred to in the property description are the ones listed below:
Project Viewer
Project Manager
Project Lead
Project Approver
Resource Requestor
This report is available with the Project Portfolio family of licenses.
Topics covered on this help page include:
Selection Criteria (options available to tailor chart output)
You may also be interested in:
Project Accounting > Instructional Guide (search for this topic in the Knowledge Center)
Fiscal Year (Define Project Accounting Fiscal Year begin and end dates)
Cost Elements (Define list of Labor, ODC and Indirect Cost pools)
Cost Report (Define the list of Cost Elements, formula for sub-total and total lines to be included in your Project Costing reports)
Cost Structure (Define list of Cost Structures available in your Unanet installation)
Labor Cost (Specify Labor Cost elements available for a particular Cost Structure)
ODC Costs (Specify ODC Cost elements available for a particular Cost Structure)
Indirect Costs (Define the Indirect Cost pools and their formulas for a particular Cost Structure)
Indirect Cost Rates (Maintain the Target, Provisional and Actual Indirect Cost Rates for each Indirect Cost pool for a particular Cost Structure)
Labor Cost Post (Post Labor Cost information)
Expense Report Cost Post (Post Expense Report Cost information)

|
|
See Revenue and Cost Reporting Calculations for more information about the values on this chart.
